McBride Bookkeeping.com

Bloggy Woggy

QBO Quickbooks Online How-to Guides & Tutorials

CRA - Taxes - Government Stuff | GST - PST - Payroll

....This space for Rent...

  • Home
  • FAQ
  • Services
    • Bookkeeping
    • Training
  • Clients
  • Contact
    • Blog
  • Partners
    • QBO
    • Shopify
    • QBO-Time
    • Dext

25/1/2023

How to create a custom dashboard and charts in QBO

0 Comments

Read Now
 

​QuickBooks Online advanced includes the Performance Center.

QBO Advanced Custom Charts Word Cloud in the shape of McBride Bookkeeping Logo
This is where you can find essential reports and built in performance charts. You can even create your own charts to track specific data to see how your business is growing. Let's go over where you can find built in performance charts and see how you can design your own custom charts.
Check if you have the Quickbooks Performance Centre
QBO Quickbooks Performance Centre

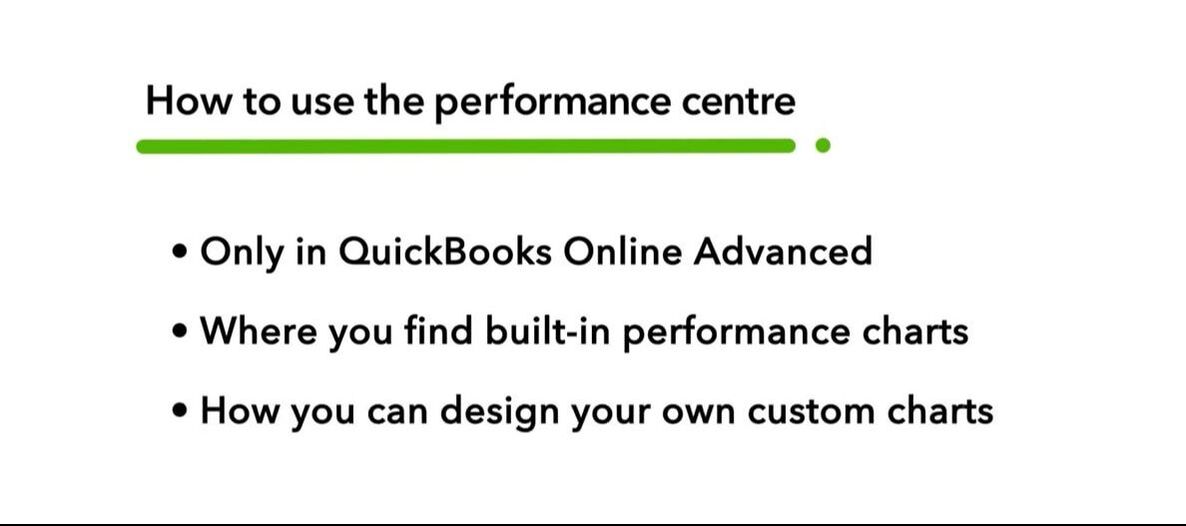
Only available with an Advanced Subscription

​Go to Reports and select Performance Center to get started. Your performance center will have some pre built charts. To know more details about a chart, move your cursor over a bar or line. You can customize the date range of some charts by selecting the down arrow and then by selecting the desired date range.

Adding a Custom chart to Quickbooks

You can also add your own charts. To do so select Add new chart, you can set up a chart to track expenses, revenue, gross profit, or any of this info.

​For this example, let's track some expenses. Select expenses, then select Continue.

Select your chart type options quickbooks advanced

Customize your new Chart

screen capture of the Edit settings for Custom chart in Quickbooks Online Advanced Performance centre
Give your chart a name. From the time period drop down select the date range you want to look at. You can easily change this later. From the group by drop down select the types of expenses you want to see on your chart, you can choose up to 10 options. Each will have their own line or bar on the chart.
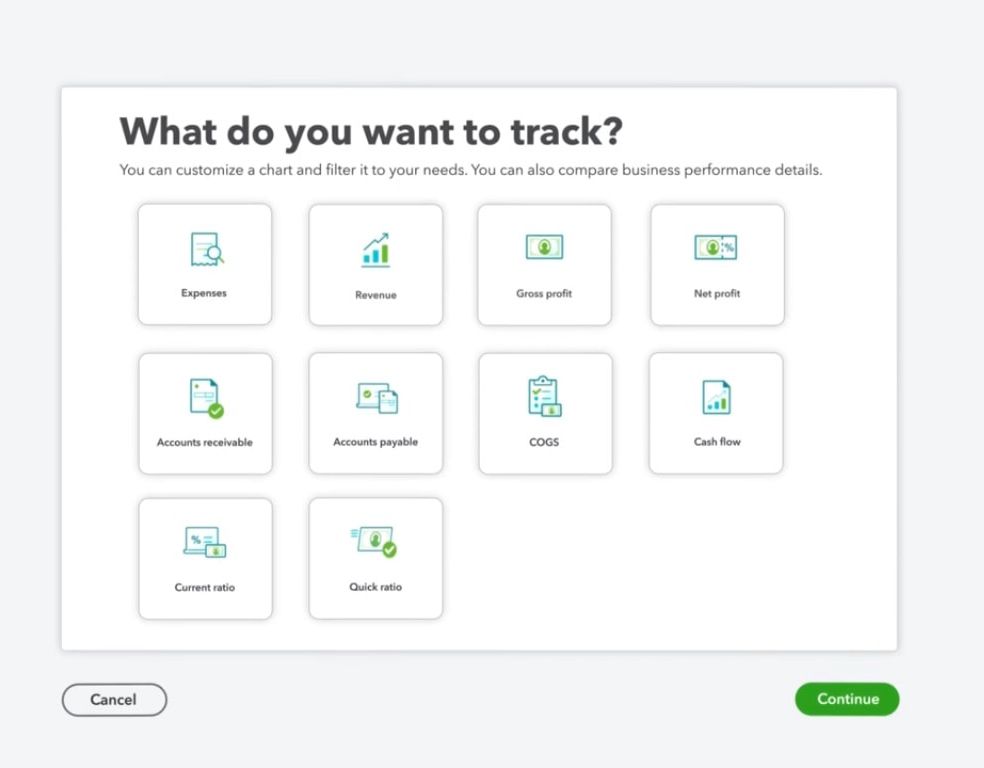
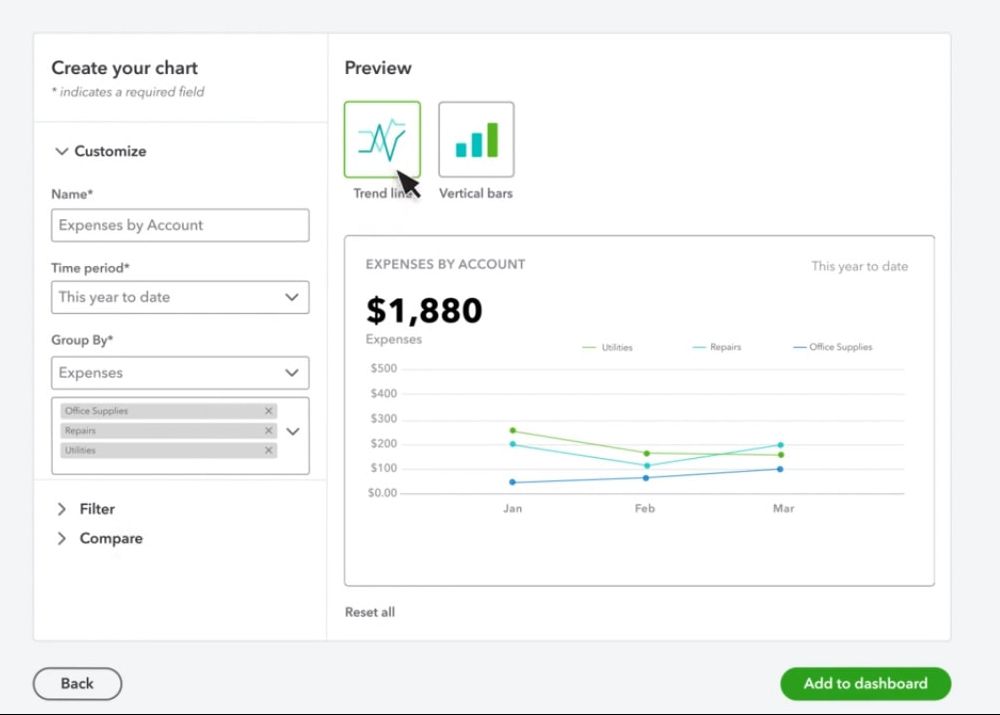
You can set more filters to choose what does and does not appear on your chart. You can also compare this data with info from other accounting periods to measure your performance over time. To set a chart type select one under preview. A trend line chart works great if you want to compare the performance of the selected items over a period of time like on this chart.

Vertical bars work best if you just want to see a single total for each piece of data the chart tracks. A great example is a vertical bar chart that tracks the net profit for your current projects. If you make a mistake and want to start over, select Reset All. Once you're done, select "Add to dashboard".

Visit the Quickbooks Online site to learn more about the Different chart options

Quickbooks Performance centre Dashboard

Your new custom chart shows up at the top of the Performance Center. The rest of your team can also see if they have the right permissions. You can change what a chart shows you. Select these three dots, then select Edit chart. Update the information you want to change then select Save.
Screenshot of QBO Quickbooks Online performance center dashboard
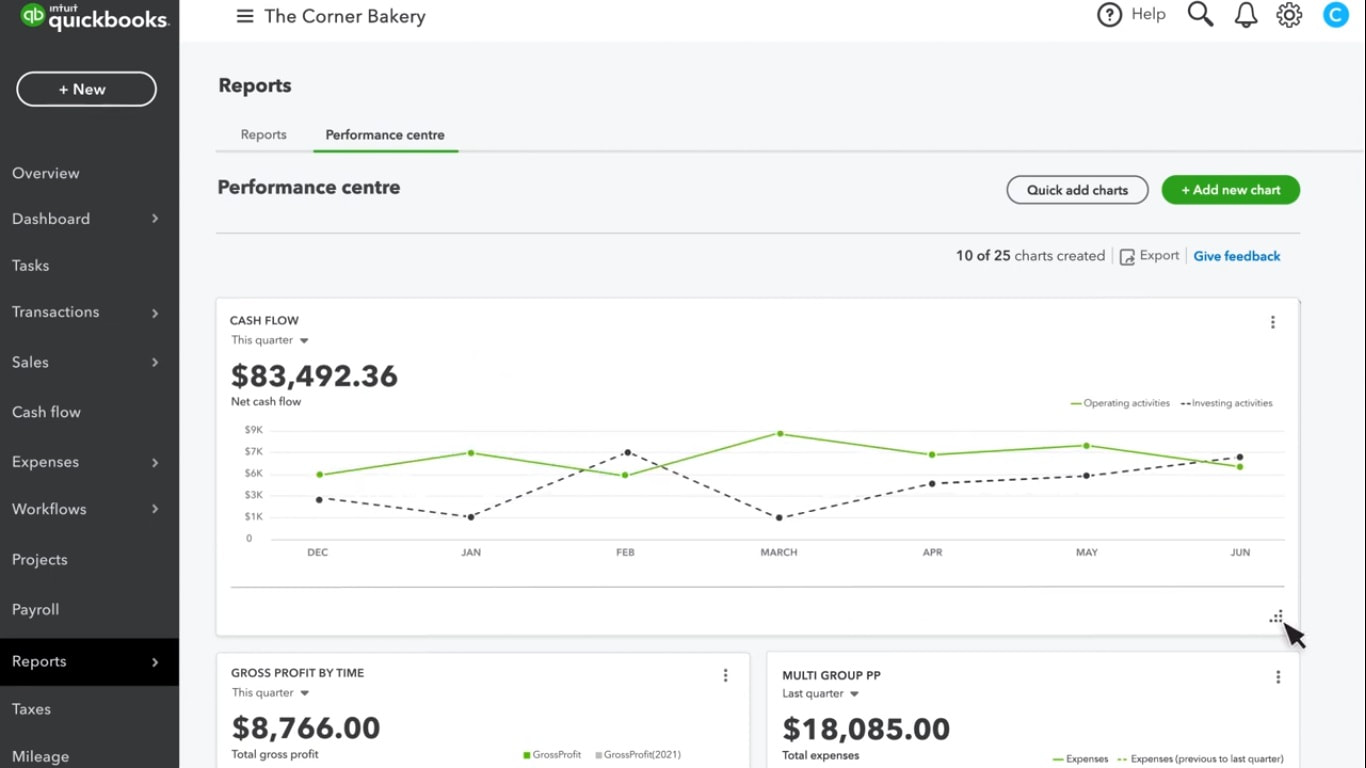
Select the three dots and you can Export or Delete a chart. To export all your charts under Performance Center, select the export icon under Add new chart.

If you want to change where a chart appears in the Performance Center, select it and then drag it to where you want it to stay. You can also change the size of a chart by selecting the dots at the right bottom of that chart and then dragging it across.
Banner telling you to start using the Quickbooks Online Advanced Performance center
​Now you can set up your own custom charts in the Performance Center and define what success means for your business.

It might not be the Performance Dashboard we all wanted but it is a step in the right Direction.

​Thanks QBO development Team !

Share

0 Comments

Your comment will be posted after it is approved.


Leave a Reply.

Details

    Author

    Richard McBride is a Business & Finance advisor with over 20 Years practical Accounting & business experience. Originally from Ireland, they moved to Vancouver BC Canada in 2009. Currently Lives in the beautiful Shuswap region with family and maintains offices in throughout BC & Canada

    Archives

    January 2023
    June 2022
    January 2022

    Categories

    All
    Charts
    Dashboards
    How To
    QB Advanced
    QBO

    RSS Feed

Quickbooks Online Advanced Certified Proadvisor
Quickbooks Online ProAdvisor
                                                      InFlow Inventory Management Partner
InFlow Inventory Software Partner
Qualified Certified Professional Bookkeeper
Certified Professional Bookkeeper
Jobber app Logo
Jobber Software Partner
Fellow of the International Association of Bookkeepers
Fellow of the Int'l Assoc. of Bookkeepers
Certified Shopify ecommerce solution provider
Shopify eCommerce Platform Partner
Certified TSheets Quickbooks Time Tracking Pro
QBO Time (TSheets) Pro-Advisor
  • Home
  • FAQ
  • Services
    • Bookkeeping
    • Training
  • Clients
  • Contact
    • Blog
  • Partners
    • QBO
    • Shopify
    • QBO-Time
    • Dext